") 企業(yè)如何用ELK技術(shù)棧實現(xiàn)數(shù)據(jù)流量爆炸式增長
企業(yè)如何用ELK技術(shù)棧實現(xiàn)數(shù)據(jù)流量爆炸式增長

ELK簡介
什么是ELK
通俗來講,ELK 是由 Elasticsearch、Logstash、Kibana 三個開源軟件的組成的一個組合體,ELK 是 elastic 公司研發(fā)的一套完整的日志收集、分析和展示的企業(yè)級解決方案,在這三個軟件當(dāng)中,每個軟件用于完成不同的功能,ELK 又稱為ELK stack,官方域名為 elastic.co,ELK stack 的主要優(yōu)點有如下幾個:處理方式靈活:elasticsearch 是實時全文索引,具有強(qiáng)大的搜索功能配置相對簡單:elasticsearch 的 API 全部使用 JSON 接口,logstash 使用模塊配置,kibana 的配置文件部分更簡單。檢索性能高效:基于優(yōu)秀的設(shè)計,雖然每次查詢都是實時,但是也可以達(dá)到百億級數(shù)據(jù)的查詢秒級響應(yīng)。集群線性擴(kuò)展:elasticsearch 和 logstash 都可以靈活線性擴(kuò)展前端操作絢麗:kibana 的前端設(shè)計比較絢麗,而且操作簡單
Elasticsearch
Elasticsearch是個開源分布式搜索引擎,提供搜集、分析、存儲數(shù)據(jù)三大功能。它的特點有:分布式,零配置,自動發(fā)現(xiàn),索引自動分片,索引副本機(jī)制,restful風(fēng)格接口,多數(shù)據(jù)源,自動搜索負(fù)載等。主要負(fù)責(zé)將日志索引并存儲起來,方便業(yè)務(wù)方檢索查詢。
Elasticsearch 使用 Java 語言開發(fā),是建立在全文搜索引擎 Apache Lucene 基礎(chǔ)之上的搜索引擎。
Elasticsearch 的特點:
實時搜索、實時分析
分布式架構(gòu)、實時文件存儲
文檔導(dǎo)向,所有對象都是文檔
高可用,易擴(kuò)展,支持集群,分片與復(fù)制
接口友好,支持 json
Logstash
Logstash 主要是用來日志的搜集、分析、過濾日志的工具,支持大量的數(shù)據(jù)獲取方式。一般工作方式為c/s架構(gòu),client端安裝在需要收集日志的主機(jī)上,server端負(fù)責(zé)將收到的各節(jié)點日志進(jìn)行過濾、修改等操作在一并發(fā)往elasticsearch上去。是一個日志收集、過濾、轉(zhuǎn)發(fā)的中間件,主要負(fù)責(zé)將各條業(yè)務(wù)線的各類日志統(tǒng)一收集、過濾后,轉(zhuǎn)發(fā)給 Elasticsearch 進(jìn)行下一步處理。
Kibana
Kibana 也是一個開源和免費的工具,Kibana可以為 Logstash 和 ElasticSearch 提供的日志分析友好的 Web 界面,可以幫助匯總、分析和搜索重要數(shù)據(jù)日志。
ELK的工作原理
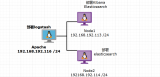
1.在所有需要收集日志的服務(wù)器上部署Logstash;或者先將日志進(jìn)行集中化管理在日志服務(wù)器上,在日志服務(wù)器上部署 Logstash。
2.Logstash 收集日志,將日志格式化并輸出到 Elasticsearch 群集中。
3.Elasticsearch 對格式化后的數(shù)據(jù)進(jìn)行索引和存儲。
4.Kibana 從 ES 群集中查詢數(shù)據(jù)生成圖表,并進(jìn)行前端數(shù)據(jù)的展示。
ELK安裝部署
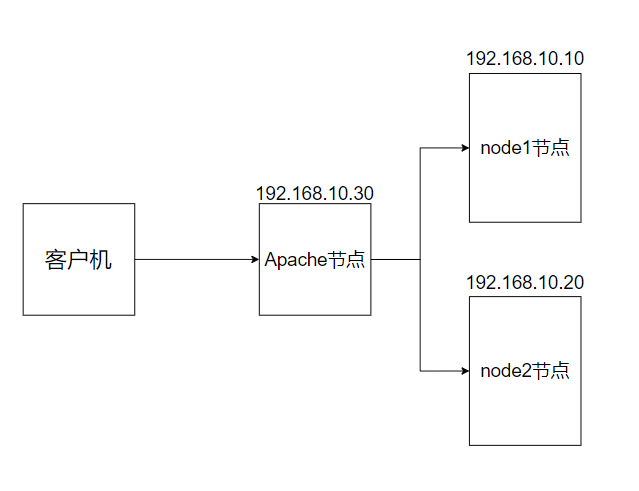
前期準(zhǔn)備
所以設(shè)備
[root@localhost ~]# systemctl disable  --now   firewalld
[root@localhost ~]# setenforce 0
[root@localhost ~]# yum -y install java
[root@localhost ~]# hostnamectl set-hostname node1/node2/apache
#更改設(shè)備名稱
安裝部署 Elasticsearch 軟件
安裝 Elasticsearch 軟件
#在軟件官網(wǎng)下載所需的安裝包到/data
[root@localhost data]# ls
elasticsearch-6.7.2.rpm  elasticsearch-head-master.zip  node-v8.2.1.tar.gz  phantomjs-2.1.1-linux-x86_64.tar.bz2


#用rpm安裝Elasticsearch軟件
[root@localhost data]#rpm -ivh elasticsearch-6.7.2.rpm

[root@localhost data]# cd /etc/elasticsearch/
[root@localhost elasticsearch]# mkdir bak
[root@localhost elasticsearch]# cp -a *.yml  bak/
#備份要修改的文件,方便還原配置文件
修改配置文件
[root@node1 elasticsearch]# vim elasticsearch.yml
17 cluster.name: my-elk-cluster#修改集群名字

23 node.name: node1#設(shè)置節(jié)點名稱主從之間不能一致
24 node.master: true#作為主節(jié)點
25 node.data: true#作為數(shù)據(jù)節(jié)點

45 bootstrap.memory_lock: true#內(nèi)存鎖開啟  禁止使用  swap

59 network.host: 0.0.0.0#監(jiān)聽地址
60 http.port: 9200#默認(rèn)使用端口
61 transport.tcp.port: 9300#內(nèi)部傳輸端口

73 discovery.zen.ping.unicast.hosts: ["192.168.10.10:9300", "192.168.10.20:9300"] #自動集群發(fā)現(xiàn),加入主機(jī)名  使用單播 類似心跳線


#再次查看數(shù)據(jù)是否更改完成
[root@localhost elasticsearch]# grep -v "^#"  elasticsearch.yml
cluster.name: my-elk-cluster
node.name: node1
node.master: true
node.data: true
path.data: /var/lib/elasticsearch
path.logs: /var/log/elasticsearch
bootstrap.memory_lock: true
network.host: 0.0.0.0
http.port: 9200
transport.tcp.port: 9300
discovery.zen.ping.unicast.hosts: ["192.168.10.10:9300", "192.168.10.20:9300"]
修改系統(tǒng)配置
性能調(diào)優(yōu)參數(shù)
[root@localhost elasticsearch]# vim /etc/security/limits.conf
......
#在最后添加
*  soft    nofile          65536
*  hard    nofile          65536
*  soft    nproc           32000
*  hard    nproc           32000
*  soft    memlock         unlimited
*  hard    memlock         unlimited
修改systemd 服務(wù)管理器
/etc/systemd/system.conf 文件是用于配置 systemd 的,這是一種用于 Linux 操作系統(tǒng)的系統(tǒng)和服務(wù)管理器。通過這個文件,你可以自定義與系統(tǒng)操作、性能和行為相關(guān)的各種設(shè)置
DefaultTimeoutStartSec=:設(shè)置啟動服務(wù)的默認(rèn)等待時間
DefaultTimeoutStopSec=:設(shè)置停止服務(wù)的默認(rèn)等待時間
DefaultRestartSec=:設(shè)置在重新啟動服務(wù)之前的默認(rèn)休眠時間
DefaultLimitNOFILE=:設(shè)置打開文件數(shù)量的默認(rèn)限制
DefaultLimitNPROC=:設(shè)置進(jìn)程數(shù)量的默認(rèn)限制
DefaultLimitCORE=:設(shè)置核心文件大小的默認(rèn)限制
DefaultEnvironment=:指定服務(wù)的默認(rèn)環(huán)境變量
實際修改
[root@localhost elasticsearch]# vim /etc/systemd/system.conf
DefaultLimitNOFILE=65536
DefaultLimitNPROC=32000
DefaultLimitMEMLOCK=infinity
修改內(nèi)核參數(shù)
[root@localhost elasticsearch]# vim /etc/sysctl.conf
#一個進(jìn)程可以擁有的最大內(nèi)存映射區(qū)域數(shù),參考數(shù)據(jù)(分配 2g/262144,4g/4194304,8g/8388608)
vm.max_map_count=262144

[root@localhost elasticsearch]# sysctl -p#讀取并應(yīng)用這些配置更改,無需重新啟動系統(tǒng)效。
[root@localhost elasticsearch]# sysctl -a | grep vm.max_map_count
重啟服務(wù)器啟動elasticsearch
[root@localhost elasticsearch]# reboot#重啟服務(wù)器
[root@localhost ~]# systemctl start elasticsearch.service#啟動elasticsearch
[root@localhost ~]# systemctl enable elasticsearch.service#設(shè)置開機(jī)啟動
[root@localhost ~]# ss -natp | grep 9200#查看端口號
查看節(jié)點信息
瀏覽器訪問 http://192.168.10.10:9200 http://192.168.10.20:9200 查看節(jié)點 Node1、Node2 的信息。 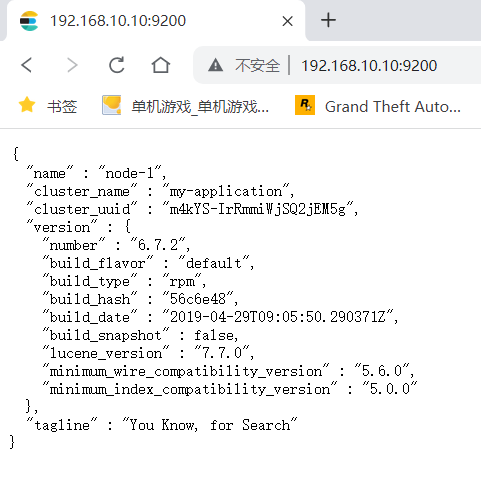 瀏覽器訪問 http://192.168.10.10:9200/_cluster/health?pretty http://192.168.10.20:9200/_cluster/health?pretty 查看群集的健康情況,可以看到 status 值為 green(綠色), 表示節(jié)點健康運行。 瀏覽器訪問 http://192.168.10.10:9200/_cluster/state?pretty 檢查群集狀態(tài)信息
編譯安裝 Elasticsearch-head 插件 主從都可以安裝
Elasticsearch 在 5.0 版本后,Elasticsearch-head 插件需要作為獨立服務(wù)進(jìn)行安裝,需要使用npm工具(NodeJS的包管理工具)安裝。
安裝 Elasticsearch-head 需要提前安裝好依賴軟件node和phantomjs。
node:是一個基于 Chrome V8 引擎的 JavaScript 運行環(huán)境。
phantomjs:是一個基于 webkit 的JavaScriptAPI,可以理解為一個隱形的瀏覽器,任何基于 webkit 瀏覽器做的事情,它都可以做到。
編譯安裝node組件
[root@localhost ~]# yum install gcc gcc-c++ make -y
#下載安裝和解壓環(huán)境
[root@localhost ~]# cd /data/
[root@localhost data]# tar zxvf node-v8.2.1.tar.gz
[root@localhost data]# cd node-v8.2.1/
[root@localhost node-v8.2.1]# ./configure
[root@localhost node-v8.2.1]# make && make install
安裝 phantomjs
[root@localhost node-v8.2.1]# cd /data
[root@localhost data]# tar jxvf phantomjs-2.1.1-linux-x86_64.tar.bz2
[root@localhost data]# cd /data/phantomjs-2.1.1-linux-x86_64/bin
[root@localhost bin]# ln -s  /opt/phantomjs-2.1.1-linux-x86_64/bin/phantomjs   /usr/bin
安裝 Elasticsearch-head 數(shù)據(jù)可視化工具
[root@localhost bin]# cd /data
[root@localhost data]# unzip elasticsearch-head-master.zip
[root@localhost data]# cd /data/elasticsearch-head-master/
[root@localhost elasticsearch-head-master]#npm install #安裝依賴包
[root@localhost elasticsearch-head-master]#npm install --registry=https://registry.npmmirror.com      #指定源
修改 Elasticsearch 主配置文件
[root@localhost elasticsearch-head-master]# vim /etc/elasticsearch/elasticsearch.yml
......
--末尾添加以下內(nèi)容--
http.cors.enabled: true#開啟跨域訪問支持,默認(rèn)為 false
http.cors.allow-origin: "*"#指定跨域訪問允許的域名地址為所有


[root@localhost elasticsearch-head-master]# systemctl restart elasticsearch
#重啟elasticsearch  服務(wù)
啟動 elasticsearch-head 服務(wù)
必須在解壓后的 elasticsearch-head 目錄下啟動服務(wù),進(jìn)程會讀取該目錄下的 gruntfile.js 文件,否則可能啟動失敗。
[root@localhost elasticsearch-head-master]#cd /data/elasticsearch-head-master/
[root@localhost elasticsearch-head-master]# npm run start &
> elasticsearch-head@0.0.0 start /usr/local/src/elasticsearch-head
> grunt server

Running "connect:server" (connect) task
Waiting forever...
Started connect web server on http://localhost:9100

#elasticsearch-head 監(jiān)聽的端口是 9100
[root@localhost elasticsearch-head-master]# ss -natp |grep 9100
#檢測9100 端口是否開啟
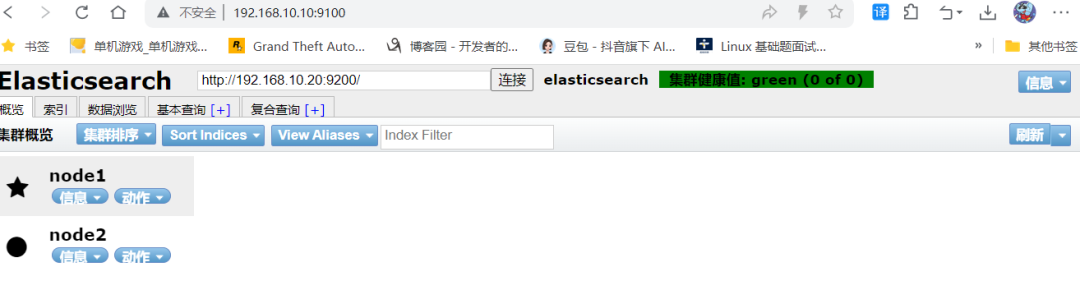
測試
網(wǎng)頁訪問:192.168.10.10:9100 或 192.168.10.20:9100
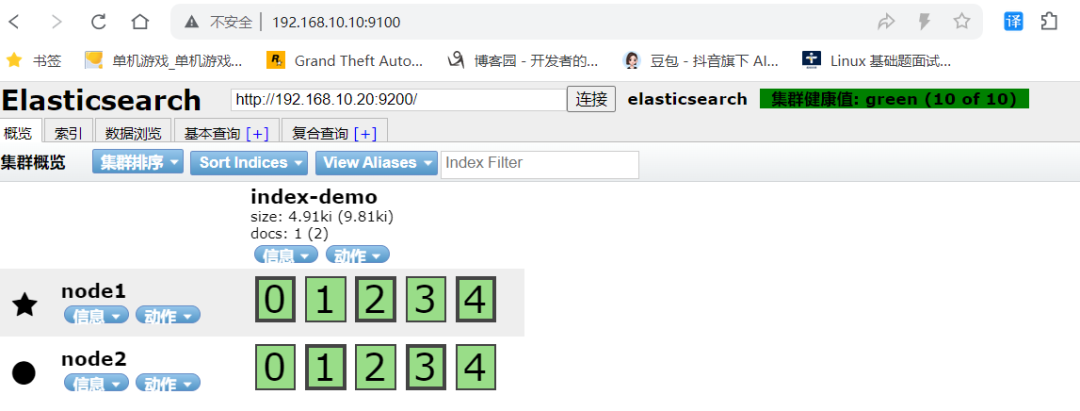
插入索引測試
[root@node2 elasticsearch-head-master]# curl -X PUT 'localhost:9200/index-demo/test/1?pretty&pretty' -H 'content-Type: application/json' -d '{"user":"zhangsan","mesg":"hello world"}'
{
  "_index" : "index-demo",
  "_type" : "test",
  "_id" : "1",
  "_version" : 1,
  "result" : "created",
  "_shards" : {
    "total" : 2,
    "successful" : 2,
    "failed" : 0
  },
  "_seq_no" : 0,
  "_primary_term" : 1
}
在應(yīng)用服務(wù)器部署 Logstash
安裝服務(wù)
[root@apache ~]# yum -y install java
[root@apache ~]# java -version
[root@apache ~]# yum -y install httpd
[root@apache ~]# systemctl start httpd
安裝logstash
[root@apache ~]# cd /data
[root@apache data]# ls
kibana-6.7.2-x86_64.rpm  logstash-6.7.2.rpm
[root@apache data]# rpm -ivh logstash-6.7.2.rpm
#安裝logstash
[root@apache data]# systemctl enable --now logstash.service
#開啟logstash.service
[root@apache data]# ln -s  /usr/share/logstash/bin/logstash   /usr/bin/
# 做軟連接
使用logstash 收集日志
Logstash 命令常用選項:
-f:通過這個選項可以指定 Logstash 的配置文件,根據(jù)配置文件配置 Logstash 的輸入和輸出流。
-e:從命令行中獲取,輸入、輸出后面跟著字符串,該字符串可以被當(dāng)作 Logstash 的配置(如果是空,則默認(rèn)使用 stdin 作為輸入,stdout 作為輸出)。
-t:測試配置文件是否正確,然后退出。
[root@localhost opt]# logstash -e 'input { stdin{} } output { stdout{} }'
# 等待時間較長
WARNING: Could not find logstash.yml which is typically located in $LS_HOME/config or /etc/logstash. You can specify the path using --path.settings. Continuing using the defaults
Could not find log4j2 configuration at path /usr/share/logstash/config/log4j2.properties. Using default config which logs errors to the console
[INFO ] 2024-08-01 1530.012 [main] writabledirectory - Creating directory {:setting=>"path.queue", :path=>"/usr/share/logstash/data/queue"}
[INFO ] 2024-08-01 1530.031 [main] writabledirectory - Creating directory {:setting=>"path.dead_letter_queue", :path=>"/usr/share/logstash/data/dead_letter_queue"}
[WARN ] 2024-08-01 1530.392 [LogStash::Runner] multilocal - Ignoring the 'pipelines.yml' file because modules or command line options are specified
[INFO ] 2024-08-01 1530.399 [LogStash::Runner] runner - Starting Logstash {"logstash.version"=>"6.7.2"}
[INFO ] 2024-08-01 1530.425 [LogStash::Runner] agent - No persistent UUID file found. Generating new UUID {:uuid=>"a499dafc-ae55-41da-b12d-36425108a95e", :path=>"/usr/share/logstash/data/uuid"}
[INFO ] 2024-08-01 1535.985 [Converge PipelineAction::Create] pipeline - Starting pipeline {:pipeline_id=>"main", "pipeline.workers"=>2, "pipeline.batch.size"=>125, "pipeline.batch.delay"=>50}
[INFO ] 2024-08-01 1536.390 [Converge PipelineAction::Create] pipeline - Pipeline started successfully {:pipeline_id=>"main", :thread=>"#"}
The stdin plugin is now waiting for input:
[INFO ] 2024-08-01 1536.458 [Ruby-0-Thread-1: /usr/share/logstash/lib/bootstrap/environment.rb:6] agent - Pipelines running {:count=>1, :running_pipelines=>[:main], :non_running_pipelines=>[]}
[INFO ] 2024-08-01 1536.734 [Api Webserver] agent - Successfully started Logstash API endpoint {:port=>9600}


# 此處輸入需要的信息
hello world
#############
/usr/share/logstash/vendor/bundle/jruby/2.5.0/gems/awesome_print-1.7.0/lib/awesome_print/formatters/base_formatter.rb warning: constant ::Fixnum is deprecated
{
       "message" => "hello world",
          "host" => "localhost.localdomain",
      "@version" => "1",
    "@timestamp" => 2024-07-15T1654.195Z
}
使用 Logstash 將信息寫入 Elasticsearch 中
logstash -e 'input { stdin{} } output { elasticsearch { hosts=>["192.168.10.10:9200","192.168.10.20:9200"]} }'
//結(jié)果不在標(biāo)準(zhǔn)輸出顯示,而是發(fā)送至 Elasticsearch 中,可瀏覽器訪問 http://192.168.10.10:9100/或http://192.168.10.20:9100 查看索引信息和數(shù)據(jù)瀏覽。
使用配置文件
Logstash 配置文件基本由三部分組成:input、output 以及 filter(可選,根據(jù)需要選擇使用)
input:表示從數(shù)據(jù)源采集數(shù)據(jù),常見的數(shù)據(jù)源如Kafka、日志文件等
file beats kafka redis stdin
filter:表示數(shù)據(jù)處理層,包括對數(shù)據(jù)進(jìn)行格式化處理、數(shù)據(jù)類型轉(zhuǎn)換、數(shù)據(jù)過濾等,支持正則表達(dá)式
grok 對若干個大文本字段進(jìn)行再分割成一些小字段 (?<字段名>正則表達(dá)式) 字段名: 正則表達(dá)式匹配到的內(nèi)容
date 對數(shù)據(jù)中的時間格式進(jìn)行統(tǒng)一和格式化
mutate 對一些無用的字段進(jìn)行剔除,或增加字段
mutiline 對多行數(shù)據(jù)進(jìn)行統(tǒng)一編排,多行合并或拆分
output:表示將Logstash收集的數(shù)據(jù)經(jīng)由過濾器處理之后輸出到Elasticsearch。
elasticsearch stdout
#格式如下:
input {...}
filter {...}
output {...}

#在每個部分中,也可以指定多個訪問方式。例如,若要指定兩個日志來源文件,則格式如下:
input {
file { path =>"/var/log/messages"   type =>"syslog"}
file { path =>"/var/log/httpd/access.log" type =>"apache"}

vim system.conf
input {
    file{
        path =>"/var/log/messages"
        type =>"system"
        start_position =>"beginning"
# ignore_older => 604800
        sincedb_path => "/etc/logstash/sincedb_path/log_progress"
        add_field => {"log_hostname"=>"${HOSTNAME}"}
    }
}
#path表示要收集的日志的文件位置
#type是輸入ES時給結(jié)果增加一個叫type的屬性字段
#start_position可以設(shè)置為beginning或者end,beginning表示從頭開始讀取文件,end表示讀取最新的,這個要和ignore_older一起使用
#ignore_older表示了針對多久的文件進(jìn)行監(jiān)控,默認(rèn)一天,單位為秒,可以自己定制,比如默認(rèn)只讀取一天內(nèi)被修改的文件
#sincedb_path表示文件讀取進(jìn)度的記錄,每行表示一個文件,每行有兩個數(shù)字,第一個表示文件的inode,第二個表示文件讀取到的位置(byteoffset)。默認(rèn)為$HOME/.sincedb*
#add_field增加屬性。這里使用了${HOSTNAME},即本機(jī)的環(huán)境變量,如果要使用本機(jī)的環(huán)境變量,那么需要在啟動命令上加--alow-env

output {
    elasticsearch {#輸出到 elasticsearch
        hosts => ["192.168.91.100:9200","192.168.91.101:9200"]#指定 elasticsearch 服務(wù)器的地址和端口
        index =>"system-%{+YYYY.MM.dd}"#指定輸出到 elasticsearch 的索引格式
    }
}
實列
[root@apache log]# vim /etc/logstash/conf.d/system-log.conf

input {
    file {
      path => "/var/log/messages"
      type => "system"
      start_position => "beginning"
    }

    file {
      path => "/var/log/yum.log"
      type => "yum"
      start_position => "beginning"
    }

}

output {
  if  type]
  elasticsearch {
  hosts => [ "192.168.91.100:9200","192.168.91.101:9200" ]
  index => "system-%{+YYYY.MM.dd}"
  }

}


[root@apache conf.d]# chmod +r /var/log/messages
#添加權(quán)限


[root@apache conf.d]# logstash   -f  system-log.conf
#啟動logstash
........................................................................
[INFO ] 2024-07-16 0141.716 [Api Webserver] agent - Successfully started Logstash API endpoint {:port=>9601}
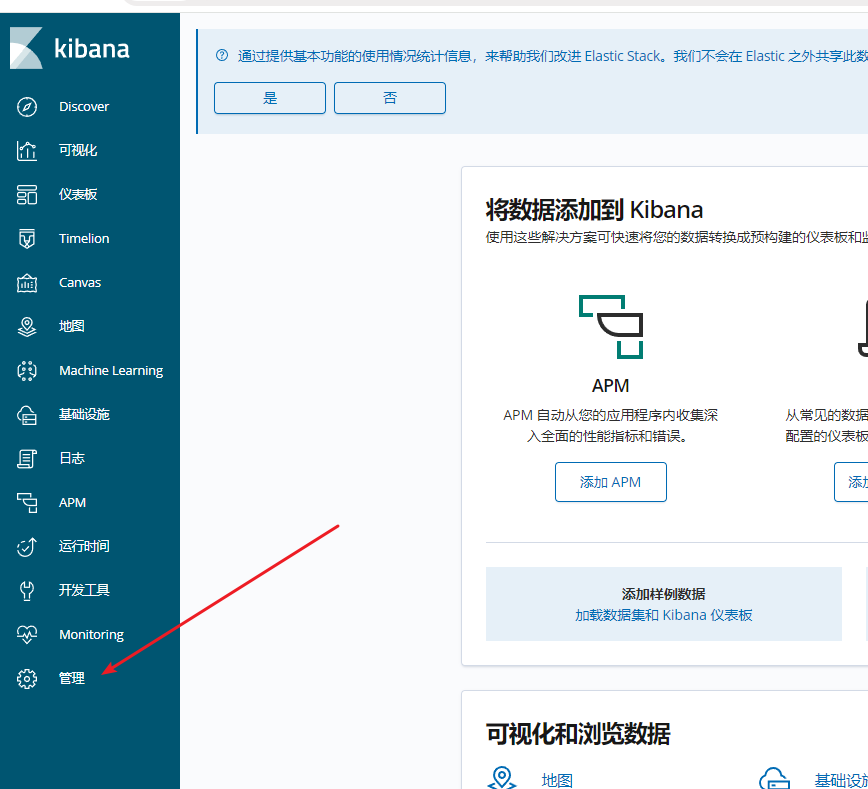
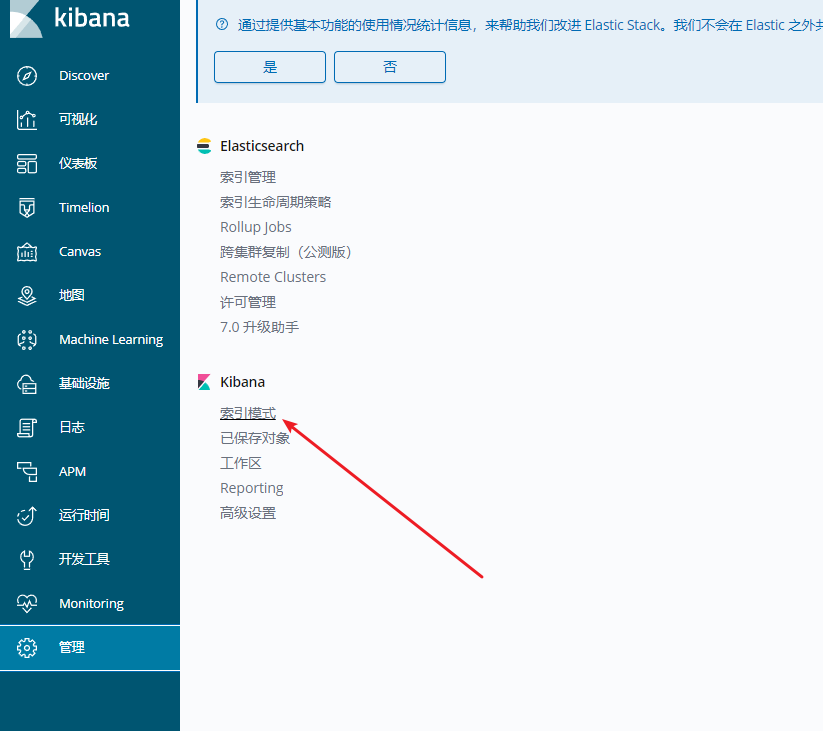
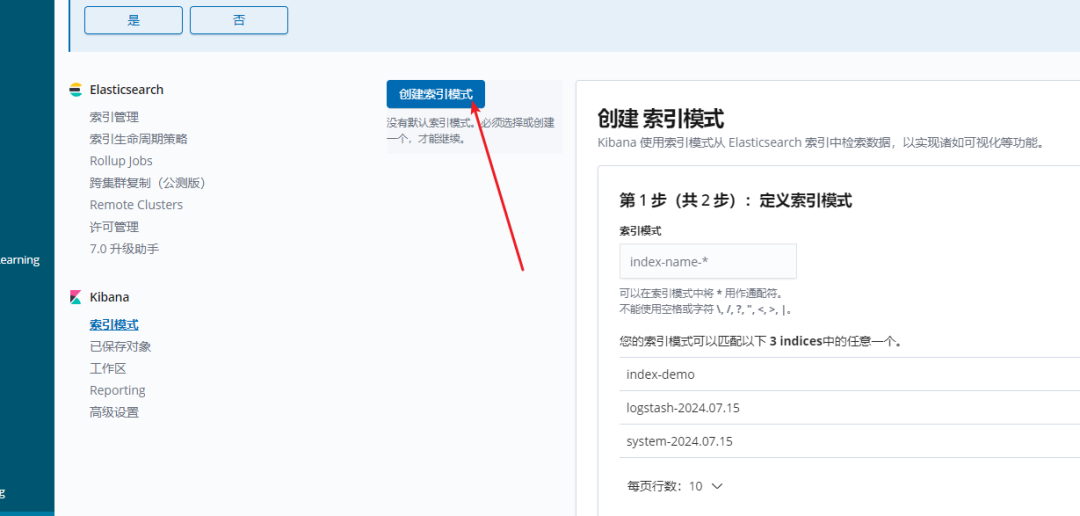
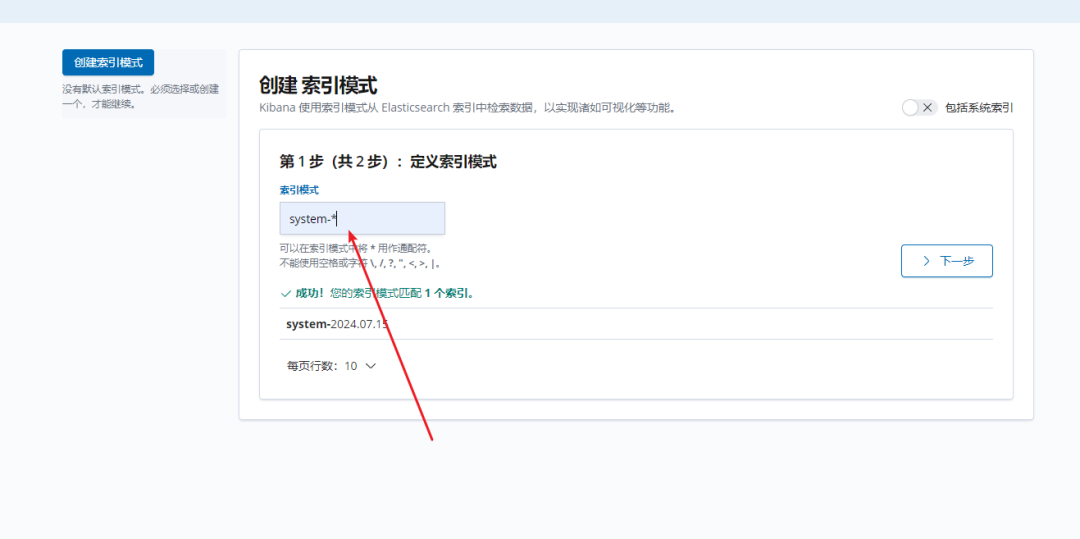
安裝 kibana 無所謂哪臺服務(wù)器
安裝
[root@apache log]# cd /data/
[root@apache data]# rpm -ivh kibana-6.7.2-x86_64.rpm
修改配置
[root@apache data]# cd /etc/kibana/
[root@localhost kibana]# cp kibana.yml  kibana.yml.bak -a
# 做好主要配置文件的備份
[root@apache kibana]# vim kibana.yml
# 修改以下行
2    server.port: 5601          #打開端口
7    server.host: "0.0.0.0"      #監(jiān)聽端口
28   elasticsearch.hosts: ["http://192.168.91.100:9200", "http://192.168.91.101:9200"]  #el服務(wù)器地址
37   kibana.index: ".kibana"         #打開索引
96   logging.dest: /var/log/k.log      #指定日志文件, 需要手動建立文件
114  i18n.locale: "zh-CN"              #中文設(shè)置

[root@apache kibana]# chown kibana:kibana /var/log/k.log
啟動 kibana
[root@apache kibana]# systemctl enable --now kibana.service
[root@apache kibana]# ss -nap |grep 5601
tcp    LISTEN     0      128       *:5601                  *:*                   users:(("node",pid=42235,fd=19))
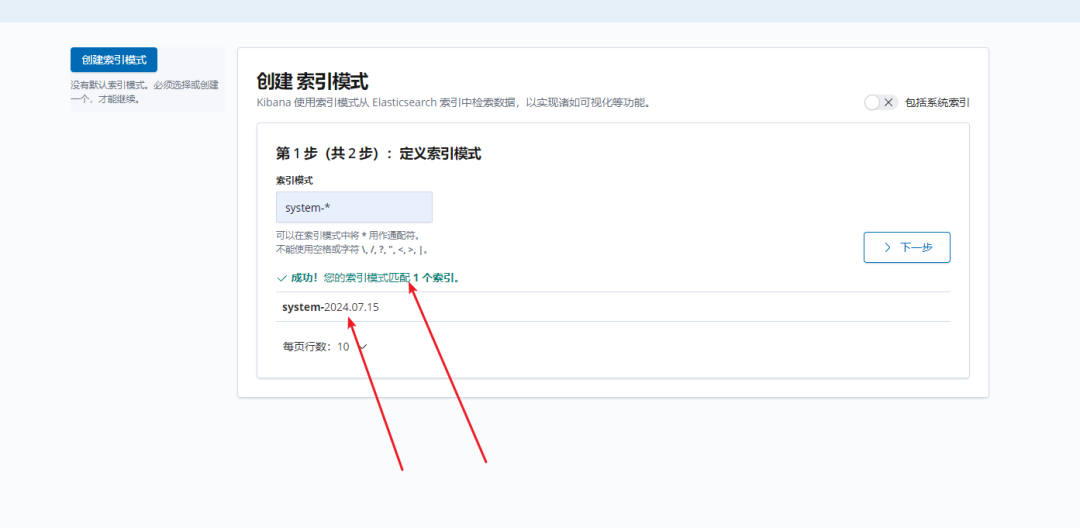
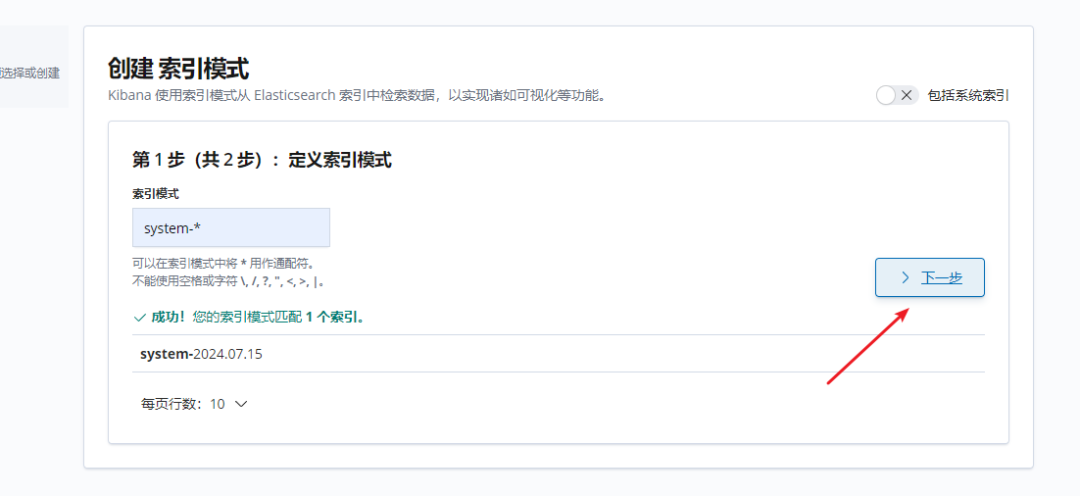
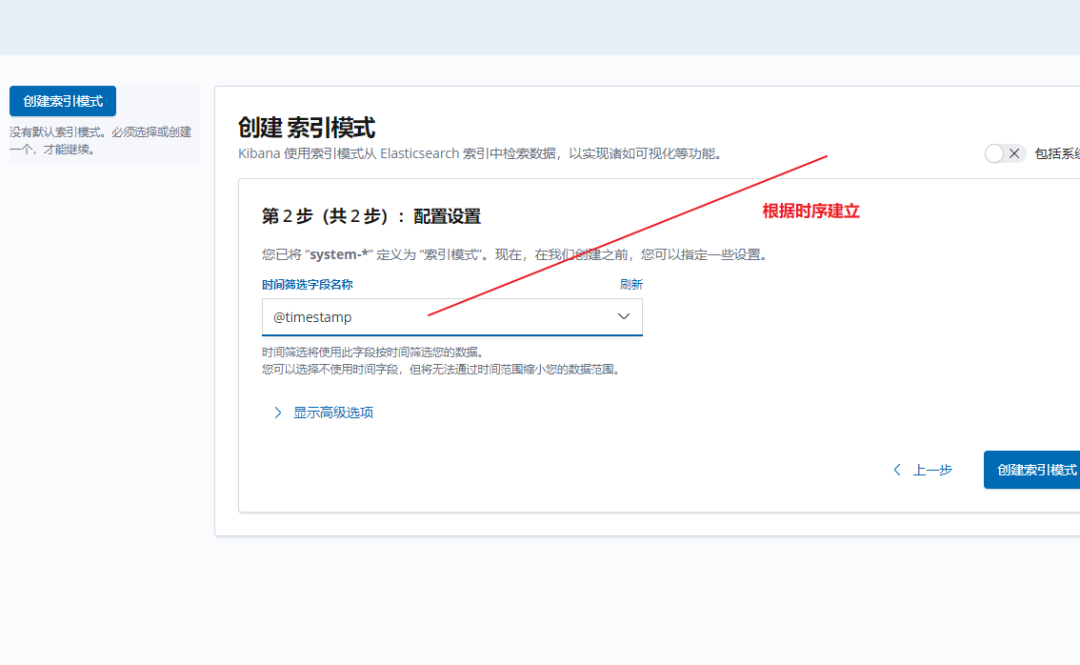
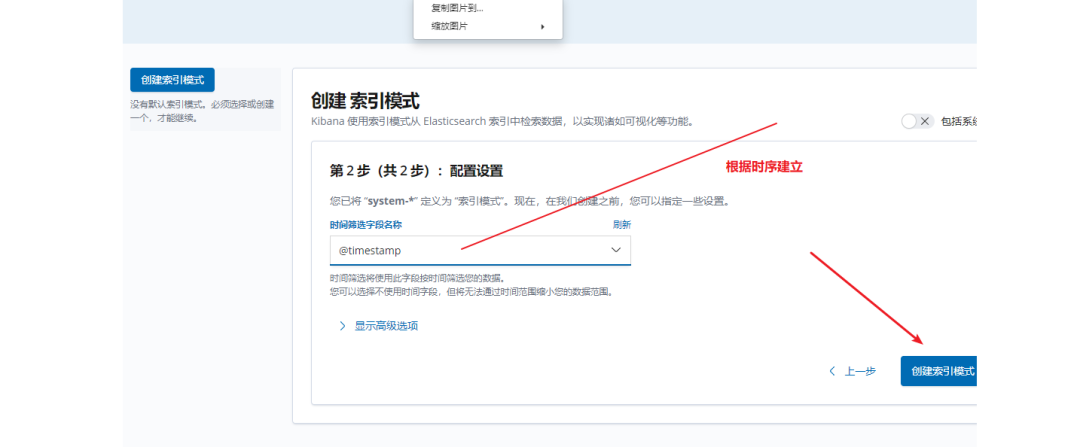
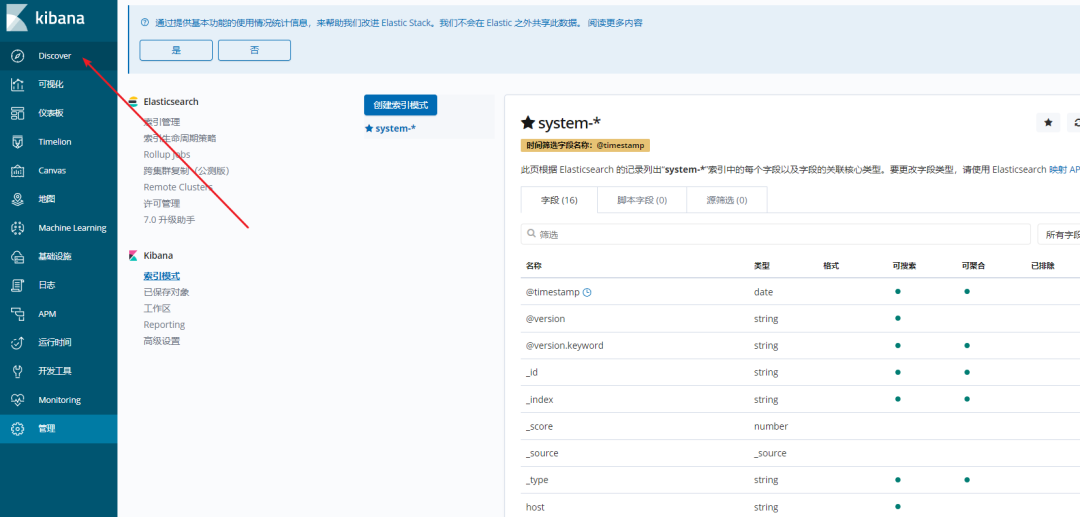
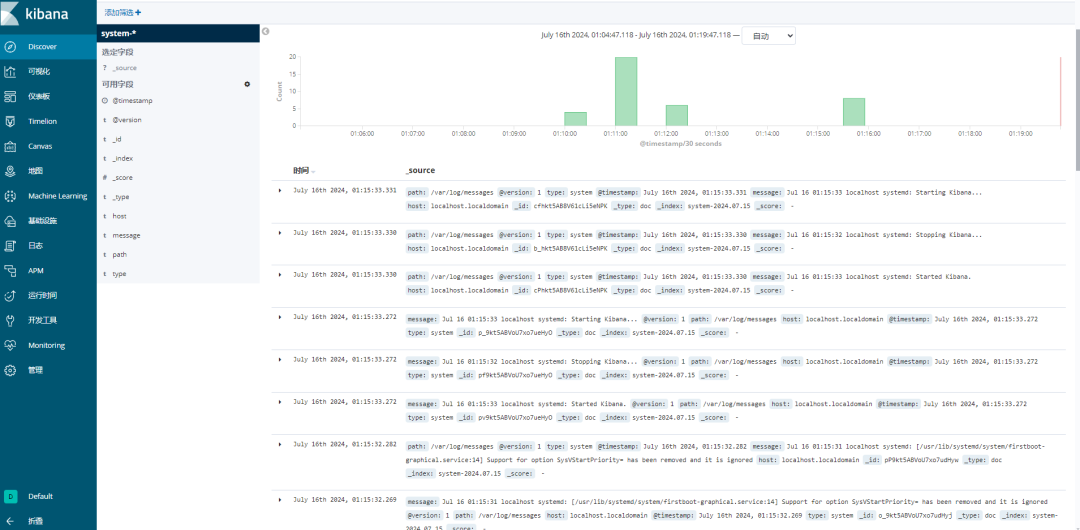
訪問測試
192.168.10.30:5601

鏈接:https://www.cnblogs.com/zhj0708/p/18336510
-
開源軟件
+關(guān)注
關(guān)注
0文章
215瀏覽量
16619 -
Elasticsearch
+關(guān)注
關(guān)注
0文章
30瀏覽量
3150
原文標(biāo)題:揭秘ELK技術(shù)棧:企業(yè)如何用它實現(xiàn)數(shù)據(jù)流量爆炸式增長
文章出處:【微信號:magedu-Linux,微信公眾號:馬哥Linux運維】歡迎添加關(guān)注!文章轉(zhuǎn)載請注明出處。
發(fā)布評論請先 登錄
EsDA科普 | AWFlow數(shù)據(jù)流圖開發(fā):讓嵌入式開發(fā)像搭積木一樣簡單

RS485轉(zhuǎn)WiFi串口數(shù)據(jù)采集透傳終端技術(shù)架構(gòu)與實現(xiàn)原理
雷達(dá)流量計的技術(shù)原理、核心參數(shù)及應(yīng)用實踐

多普勒超聲波流量計在節(jié)水灌溉流量監(jiān)測中的技術(shù)應(yīng)用

四維圖新入選第二批數(shù)據(jù)流通安全治理典型案例
API助力,讓淘寶京東拼多多店鋪流量如潮水般涌來

硬核拆解!有人物聯(lián)網(wǎng)智慧辦公方案,如何用IoT技術(shù)讓企業(yè)降本提效?

歐姆龍推出全新數(shù)據(jù)流邊緣控制器DX1

在以下嵌入式軟件設(shè)計模型中,屬于數(shù)據(jù)流模型的是,哪里有設(shè)計模型的介紹?
便攜式多普勒超聲波流量計監(jiān)測技術(shù)及工程應(yīng)用解析

雷達(dá)流量計技術(shù)特性與應(yīng)用實踐解析

助力 AI 時代,高速通信 14-100G VCSEL和 PD 芯片新品發(fā)布

DPI技術(shù)賦能:開啟智能流量分析新紀(jì)元

非接觸式雷達(dá)流量計監(jiān)測系統(tǒng)詳解

如何在CentOS系統(tǒng)中部署ELK日志分析系統(tǒng)


 工商網(wǎng)監(jiān)
評論